Introduction to statistical modelling in R
Online Workshop - Section C - SLAAS
Priyanga Dilini Talagala
29/08/2021

Tidy Workflow
Tidy Workflow
Tidy Workflow
What is the purpose of a model?
What is the purpose of a model?
How can I fit models in R?
What is a Model?
What is a Model?




What is a Model?
What is a Model?
An Approximation of reality
What is a Model?
An Approximation of reality
... with a purpose


What is the purpose of a statistical Model?
What is the purpose of a statistical Model?
Separate signal from noise
Understand trends and patterns
Identify which variables are related to a response variable
- Quantify this relationship
Make predictions about future observations
Understand underlying unexplained variability in the patterns
Compare results against other statistical models
set.seed(4343)data <- tibble(x = rnorm(1000,0,10), y = -(3*x^2) + rnorm(100, 0, 45))data1 <- data %>% filter(x<=-4)model1 <- lm(y ~x, data = data1)summary(model1)## ## Call:## lm(formula = y ~ x, data = data1)## ## Residuals:## Min 1Q Median 3Q Max ## -1862.39 -74.65 18.06 91.52 230.87 ## ## Coefficients:## Estimate Std. Error t value Pr(>|t|) ## (Intercept) 485.289 18.955 25.60 <2e-16 ***## x 84.220 1.674 50.31 <2e-16 ***## ---## Signif. codes: 0 '***' 0.001 '**' 0.01 '*' 0.05 '.' 0.1 ' ' 1## ## Residual standard error: 152.5 on 339 degrees of freedom## Multiple R-squared: 0.8819, Adjusted R-squared: 0.8815 ## F-statistic: 2531 on 1 and 339 DF, p-value: < 2.2e-16
set.seed(4343)data <- tibble(x = rnorm(1000,0,10), y = -(3*x^2) + rnorm(100, 0, 45))data1 <- data %>% filter(x<=-4)model1 <- lm(y ~x, data = data1)summary(model1)## ## Call:## lm(formula = y ~ x, data = data1)## ## Residuals:## Min 1Q Median 3Q Max ## -1862.39 -74.65 18.06 91.52 230.87 ## ## Coefficients:## Estimate Std. Error t value Pr(>|t|) ## (Intercept) 485.289 18.955 25.60 <2e-16 ***## x 84.220 1.674 50.31 <2e-16 ***## ---## Signif. codes: 0 '***' 0.001 '**' 0.01 '*' 0.05 '.' 0.1 ' ' 1## ## Residual standard error: 152.5 on 339 degrees of freedom## Multiple R-squared: 0.8819, Adjusted R-squared: 0.8815 ## F-statistic: 2531 on 1 and 339 DF, p-value: < 2.2e-16
set.seed(4343)data <- tibble(x = rnorm(1000,0,10), y = -(3*x^2) + rnorm(100, 0, 45))model2 <- lm(y ~x, data = data)summary(model2)## ## Call:## lm(formula = y ~ x, data = data)## ## Residuals:## Min 1Q Median 3Q Max ## -4651.7 -91.9 142.2 248.3 413.9 ## ## Coefficients:## Estimate Std. Error t value Pr(>|t|) ## (Intercept) -282.646 13.470 -20.983 < 2e-16 ***## x -4.497 1.366 -3.292 0.00103 ** ## ---## Signif. codes: 0 '***' 0.001 '**' 0.01 '*' 0.05 '.' 0.1 ' ' 1## ## Residual standard error: 425.7 on 998 degrees of freedom## Multiple R-squared: 0.01074, Adjusted R-squared: 0.009753 ## F-statistic: 10.84 on 1 and 998 DF, p-value: 0.001029
set.seed(4343)data <- tibble(x = rnorm(1000,0,10), y = -(3*x^2) + rnorm(100, 0, 45))model2 <- lm(y ~ poly(x,2), data = data)summary(model2)## ## Call:## lm(formula = y ~ poly(x, 2), data = data)## ## Residuals:## Min 1Q Median 3Q Max ## -131.035 -36.163 -0.415 39.876 123.578 ## ## Coefficients:## Estimate Std. Error t value Pr(>|t|) ## (Intercept) -284.295 1.676 -169.58 <2e-16 ***## poly(x, 2)1 -1401.415 53.015 -26.43 <2e-16 ***## poly(x, 2)2 -13342.884 53.015 -251.68 <2e-16 ***## ---## Signif. codes: 0 '***' 0.001 '**' 0.01 '*' 0.05 '.' 0.1 ' ' 1## ## Residual standard error: 53.02 on 997 degrees of freedom## Multiple R-squared: 0.9847, Adjusted R-squared: 0.9846 ## F-statistic: 3.202e+04 on 2 and 997 DF, p-value: < 2.2e-16

Modelling in R
Modelling in R
Explore data using ggplot before modelling
ggplot(...) + geom_point(...) + geom_smooth(...)ggplot(data, aes(x,y))+ geom_point() + geom_smooth(method = "lm", formula = y ~ x, col = "blue", se = FALSE) + geom_smooth(method = "lm", formula = y ~ poly(x,2), col = "red", se = FALSE) + theme(aspect.ratio = 1)
The linear model function
lm(y ~ x, data)
Assign the linear model to be an object
model <- lm(y ~ x, data)
model1 <- lm( body_mass_g ~ flipper_length_mm, data = penguins)
The linear model function
lm(y ~ x, data)
- Assign the linear model to be an object
model <- lm(y ~ x,
data)
model1 <- lm( body_mass_g ~ flipper_length_mm, data = penguins)summary(model1)Call:lm(formula = flipper_length_mm ~ body_mass_g, data = penguins)Residuals: Min 1Q Median 3Q Max -23.7626 -4.9138 0.9891 5.1166 16.6392 Coefficients: Estimate Std. Error t value Pr(>|t|) (Intercept) 1.367e+02 1.997e+00 68.47 <2e-16 ***body_mass_g 1.528e-02 4.668e-04 32.72 <2e-16 ***---Signif. codes: 0 '***' 0.001 '**' 0.01 '*' 0.05 '.' 0.1 ' ' 1Residual standard error: 6.913 on 340 degrees of freedom (2 observations deleted due to missingness)Multiple R-squared: 0.759, Adjusted R-squared: 0.7583 F-statistic: 1071 on 1 and 340 DF, p-value: < 2.2e-16The linear model function
lm(y ~ x, data)
- Assign the linear model to be an object
model <- lm(y ~ x,
data)
model1 <- lm( body_mass_g ~ flipper_length_mm, data = penguins)summary(model1)Call:lm(formula = flipper_length_mm ~ body_mass_g, data = penguins)Residuals: Min 1Q Median 3Q Max -23.7626 -4.9138 0.9891 5.1166 16.6392 Coefficients: Estimate Std. Error t value Pr(>|t|) (Intercept) 1.367e+02 1.997e+00 68.47 <2e-16 ***body_mass_g 1.528e-02 4.668e-04 32.72 <2e-16 ***---Signif. codes: 0 '***' 0.001 '**' 0.01 '*' 0.05 '.' 0.1 ' ' 1Residual standard error: 6.913 on 340 degrees of freedom (2 observations deleted due to missingness)Multiple R-squared: 0.759, Adjusted R-squared: 0.7583 F-statistic: 1071 on 1 and 340 DF, p-value: < 2.2e-16typeof(model1)## [1] "list"broom
let's tidy up a bit

Broom Toolkit
The
broompackage takes the messy output of built-in functions in R, such aslm,t.test, and turns them into tidy tibbles.This package provides three methods that do three distinct kinds of tidying.
tidyaugmentglance
broom::tidy
Returns the statistical findings of the model
This includes coefficients and p-values for each term in a regression
library(broom)model1 <- lm( body_mass_g ~ flipper_length_mm, data = penguins)tidy(model1)# A tibble: 2 × 5 term estimate std.error statistic p.value <chr> <dbl> <dbl> <dbl> <dbl>1 (Intercept) -5781. 306. -18.9 5.59e- 552 flipper_length_mm 49.7 1.52 32.7 4.37e-107broom::augment
Add columns to the original data that was modeled.
This includes predictions, residuals, and cluster assignments.
library(broom)model1 <- lm( body_mass_g ~ flipper_length_mm, data = penguins)augment(model1)# A tibble: 342 × 9 .rownames body_mass_g flipper_length_… .fitted .resid .hat .sigma .cooksd <chr> <int> <int> <dbl> <dbl> <dbl> <dbl> <dbl> 1 1 3750 181 3212. 538. 0.00881 394. 8.34e-3 2 2 3800 186 3461. 339. 0.00622 394. 2.33e-3 3 3 3250 195 3908. -658. 0.00344 393. 4.83e-3 4 5 3450 193 3808. -358. 0.00385 394. 1.60e-3 5 6 3650 190 3659. -9.43 0.00469 395. 1.35e-6 6 7 3625 181 3212. 413. 0.00881 394. 4.91e-3 7 8 4675 195 3908. 767. 0.00344 393. 6.56e-3 8 9 3475 193 3808. -333. 0.00385 394. 1.39e-3 9 10 4250 190 3659. 591. 0.00469 394. 5.31e-310 11 3300 186 3461. -161. 0.00622 395. 5.23e-4# … with 332 more rows, and 1 more variable: .std.resid <dbl>Plotting Augmented Data
model1 <- lm( body_mass_g ~ flipper_length_mm, data = penguins)mod1_arg <- augment(model1)mod1_arg %>% ggplot( aes(flipper_length_mm, .resid)) + geom_point() + geom_hline(yintercept = 0, color = "red", linetype='dashed') + labs(y = "Residuals", title = "Residual plot")
Plotting Augmented Data: qq-plots
model1 <- lm( body_mass_g ~ flipper_length_mm, data = penguins)mod1_arg <- augment(model1) mod1_arg %>% ggplot(aes(sample = .std.resid)) + geom_qq() + geom_qq_line(color="firebrick")
broom::glance
Returns a concise one-row summary of the model.
This typically contains values such as R2, adjusted R2, and residual standard error that are computed once for the entire model.
library(broom)model1 <- lm( body_mass_g ~ flipper_length_mm, data = penguins)glance(model1)# A tibble: 1 × 12 r.squared adj.r.squared sigma statistic p.value df logLik AIC BIC <dbl> <dbl> <dbl> <dbl> <dbl> <dbl> <dbl> <dbl> <dbl>1 0.759 0.758 394. 1071. 4.37e-107 1 -2528. 5063. 5074.# … with 3 more variables: deviance <dbl>, df.residual <int>, nobs <int>Multiple regression
Multiple regression is also possible using the same function
lm(y ~ x, data)
Multiple regression
Multiple regression is also possible using the same function
lm(y ~ x, data)
lm(y ~ x1 + x2, data)
Multiple regression
Multiple regression is also possible using the same function
lm(y ~ x, data)
lm(y ~ x1 + x2, data)
lm(y ~ x1 * x2, data)
Similarly, transformations are also quite easy to apply
lm(log(y) ~ x, data)
Similarly, transformations are also quite easy to apply
lm(log(y) ~ x, data)
lm(y ~ log(x), data)
Similarly, transformations are also quite easy to apply
lm(log(y) ~ x, data)
lm(y ~ log(x), data)
lm(y ~ poly(x, 2), data)
What about all the other kinds of model?
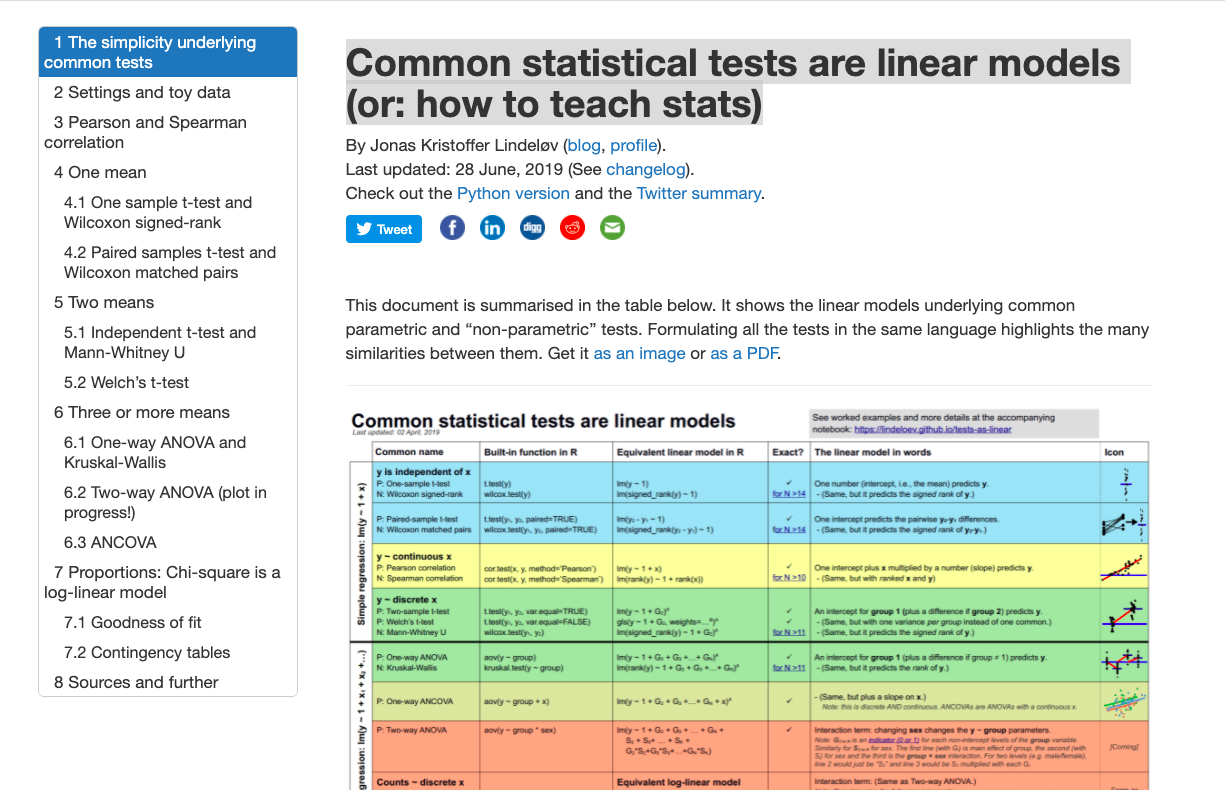
Analysis of Variance
lm(y ~ x, data)
X is categorical
Linear Regression
lm(y ~ x, data)
X is numerical
Common statistical tests are linear models (or: how to teach stats): https://lindeloev.github.io/tests-as-linear/
Other kinds of models
Not all tests are linear models
For non-normal distributions of residuals, we have generalised linear model
glm(y ~ x, data, family = "")
glm(y ~ x, data, family = "binomial")glm(y ~ x, data, family = "poisson")glm(y ~ x, data, family = "Gamma")CRAN Task Views
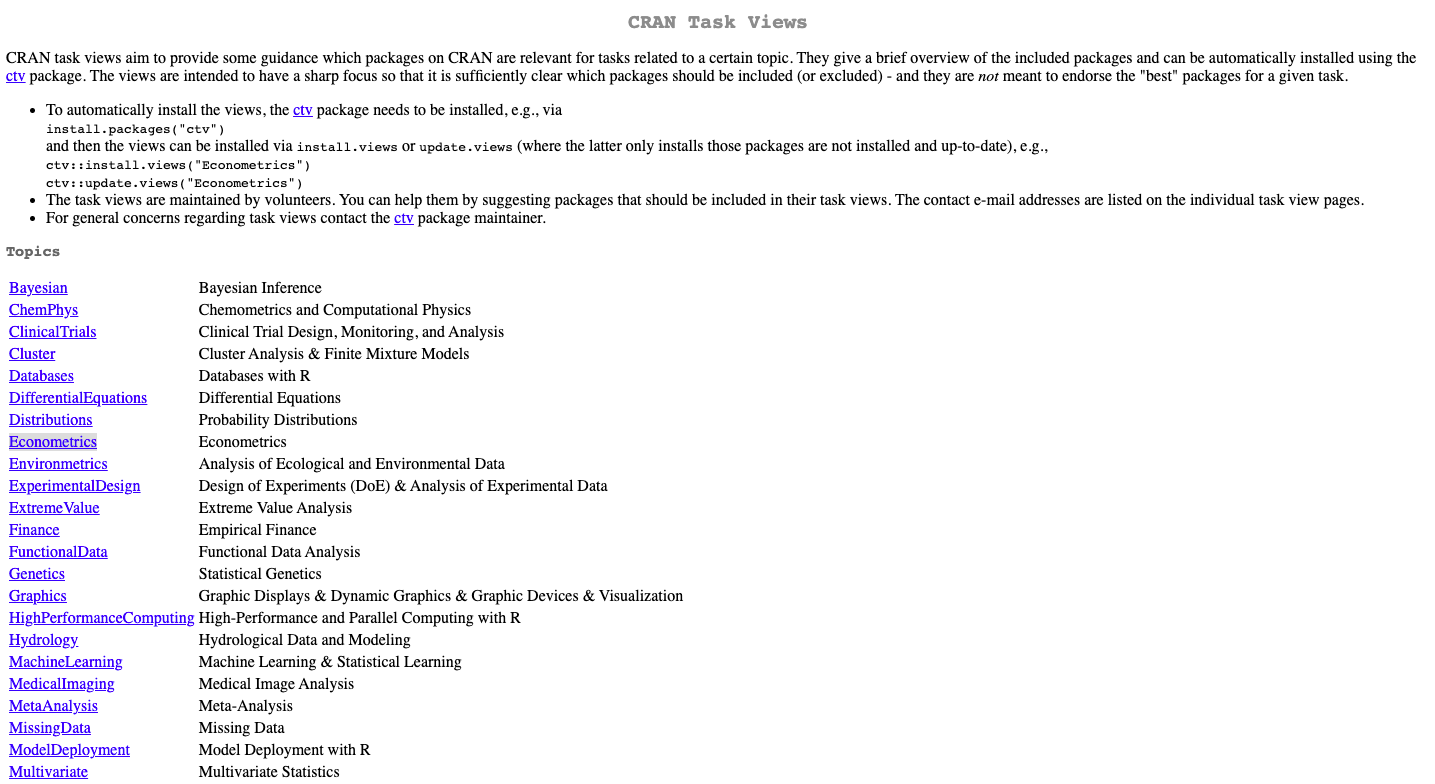
- The CRAN task view provides an overview of the packages available for various research fields and methodologies
https://cran.r-project.org/web/views/
Key points
Know your data - explore it before jumping into a formal model.
If exploration brings up something interesting or unexpected, try to incorporate this into the model.
Always consider the trade-off between something which is over-simplified and something which is over-complicated.
pridiltal and thiyangt
This work was supported in part by RETINA research lab funded by the OWSD, a program unit of United Nations Educational, Scientific and Cultural Organization (UNESCO).
All rights reserved by Thiyanga S. Talagala and Priyanga D. Talagala