Displaying Geo-Spatial Data with R
IASSL Workshop
Dr. Priyanga D. Talagala, University of Moratuwa
21-25, February, 2022
Main packages required
# Data manipulation and plotting functionslibrary(tidyverse)# sf: objects with simple featureslibrary("sf")# Provides a map of countries of the entire worldlibrary("rnaturalearth")library("rnaturalearthdata")The combination of ggplot2 and sf therefore enables to programmatically create maps.
world <- ne_countries(scale = "medium", returnclass = "sf")class(world)## [1] "sf" "data.frame"colnames(world)## [1] "scalerank" "featurecla" "labelrank" "sovereignt" "sov_a3" ## [6] "adm0_dif" "level" "type" "admin" "adm0_a3" ## [11] "geou_dif" "geounit" "gu_a3" "su_dif" "subunit" ## [16] "su_a3" "brk_diff" "name" "name_long" "brk_a3" ## [21] "brk_name" "brk_group" "abbrev" "postal" "formal_en" ## [26] "formal_fr" "note_adm0" "note_brk" "name_sort" "name_alt" ## [31] "mapcolor7" "mapcolor8" "mapcolor9" "mapcolor13" "pop_est" ## [36] "gdp_md_est" "pop_year" "lastcensus" "gdp_year" "economy" ## [41] "income_grp" "wikipedia" "fips_10" "iso_a2" "iso_a3" ## [46] "iso_n3" "un_a3" "wb_a2" "wb_a3" "woe_id" ## [51] "adm0_a3_is" "adm0_a3_us" "adm0_a3_un" "adm0_a3_wb" "continent" ## [56] "region_un" "subregion" "region_wb" "name_len" "long_len" ## [61] "abbrev_len" "tiny" "homepart" "geometry"world %>% filter(admin == "Sri Lanka")## Simple feature collection with 1 feature and 63 fields## Geometry type: MULTIPOLYGON## Dimension: XY## Bounding box: xmin: 79.70781 ymin: 5.949365 xmax: 81.87695 ymax: 9.812695## CRS: +proj=longlat +datum=WGS84 +no_defs +ellps=WGS84 +towgs84=0,0,0## scalerank featurecla labelrank sovereignt sov_a3 adm0_dif level## 1 1 Admin-0 country 3 Sri Lanka LKA 0 2## type admin adm0_a3 geou_dif geounit gu_a3 su_dif subunit## 1 Sovereign country Sri Lanka LKA 0 Sri Lanka LKA 0 Sri Lanka## su_a3 brk_diff name name_long brk_a3 brk_name brk_group abbrev postal## 1 LKA 0 Sri Lanka Sri Lanka LKA Sri Lanka <NA> Sri L. LK## formal_en formal_fr note_adm0 note_brk## 1 Democratic Socialist Republic of Sri Lanka <NA> <NA> <NA>## name_sort name_alt mapcolor7 mapcolor8 mapcolor9 mapcolor13 pop_est## 1 Sri Lanka <NA> 3 5 4 9 21324791## gdp_md_est pop_year lastcensus gdp_year economy## 1 91870 NA 2001 NA 6. Developing region## income_grp wikipedia fips_10 iso_a2 iso_a3 iso_n3 un_a3 wb_a2## 1 4. Lower middle income NA <NA> LK LKA 144 144 LK## wb_a3 woe_id adm0_a3_is adm0_a3_us adm0_a3_un adm0_a3_wb continent region_un## 1 LKA NA LKA LKA NA NA Asia Asia## subregion region_wb name_len long_len abbrev_len tiny homepart## 1 Southern Asia South Asia 9 9 6 NA 1## geometry## 1 MULTIPOLYGON (((79.8748 9.0...Creating a base map of the world using ggplot2
ggplot(data = world) + geom_sf()
ggplot(data = world) + geom_sf() + xlab("Longitude") + ylab("Latitude") + ggtitle("World map", subtitle = paste0("(", length(unique(world$NAME)), " countries)"))
Shows the population of each country using the population (which is stored in the variable POP_EST of the world object)
ggplot(data = world) + geom_sf(aes(fill = pop_est)) + scale_fill_viridis_c(option = "plasma")
Shows the population of each country using the square root of the population (which is stored in the variable POP_EST of the world object)
ggplot(data = world) + geom_sf(aes(fill = pop_est)) + scale_fill_viridis_c(option = "plasma", trans = "sqrt")
ceylon package
The goal of ceylon is to provide data to plot maps of Sri Lanka.
https://github.com/thiyangt/ceylon
# install.packages("devtools")# devtools::install_github("thiyangt/ceylon")library(ceylon)
Country level
data(sf_sl_0)ggplot(sf_sl_0) + geom_sf()
Provinces of Sri Lanka
data(province)province## Simple feature collection with 9 features and 3 fields## Geometry type: MULTIPOLYGON## Dimension: XY## Bounding box: xmin: 362203.3 ymin: 380301.9 xmax: 621918.1 ymax: 813560.9## Projected CRS: SLD99 / Sri Lanka Grid 1999## # A tibble: 9 × 4## geometry PROVINCE Status population## * <MULTIPOLYGON [m]> <chr> <chr> <dbl>## 1 (((498211.2 611042.6, 498401.7 610897.1, 498415.9 … CENTRAL Provi… 2781000## 2 (((609877 559315.9, 609857.5 559313, 609845.2 5593… EASTERN Provi… 1746000## 3 (((501928.5 712099.6, 501970.4 712098.8, 502020 71… NORTH C… Provi… 1386000## 4 (((393087.5 629959, 393098.1 629956.7, 393103.2 62… NORTH W… Provi… 2563000## 5 (((405858.7 700083.7, 405855.3 700082, 405851.5 70… NORTHERN Provi… 1152000## 6 (((432117.3 521875.5, 432083.5 521852.9, 432041.7 … SABARAG… Provi… 2070000## 7 (((481925.5 381353.7, 481922.9 381350.3, 481919 38… SOUTHERN Provi… 2669000## 8 (((522825 568220.9, 522872.6 568217.7, 522926.1 56… UVA Provi… 1387000## 9 (((411888.2 438189.4, 411886.4 438182.3, 411881.7 … WESTERN Provi… 6165000Provinces of Sri Lanka
ggplot(province) + geom_sf()
Provinces of Sri Lanka
ggplot(province) + geom_sf(mapping = aes(fill = PROVINCE), show.legend = TRUE)
Distribution of Population by Provinces
ggplot(province) + geom_sf(mapping = aes(fill = population), show.legend = TRUE)
Distribution of Population by Districts
library(viridis)data(district)ggplot(district) + geom_sf(aes(fill = population), show.legend = TRUE) + scale_fill_viridis()
Divisional secretariat
data(sf_sl_3)ggplot(sf_sl_3) + geom_sf()
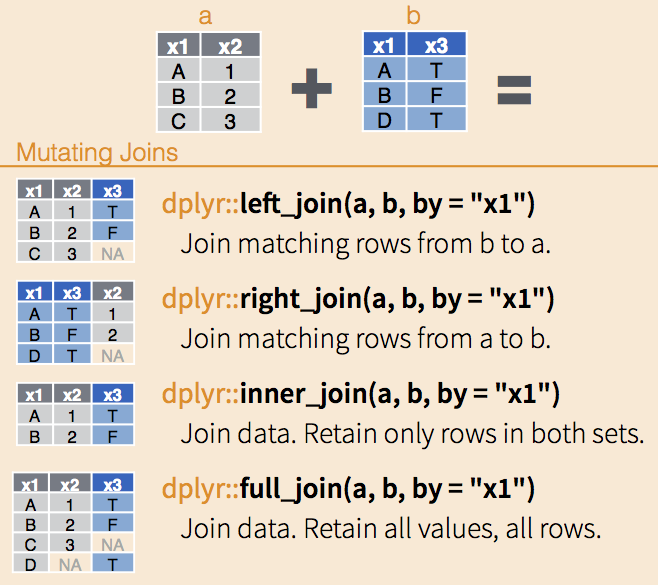
Join (merge) data with dplyr in R

Source: https://data-lessons.github.io/gapminder-R/12-joins.html
Learn more: https://rpubs.com/williamsurles/293454
head(district)## Simple feature collection with 6 features and 3 fields## Geometry type: MULTIPOLYGON## Dimension: XY## Bounding box: xmin: 391095.2 ymin: 445857.8 xmax: 621918.1 ymax: 712393.4## Projected CRS: SLD99 / Sri Lanka Grid 1999## # A tibble: 6 × 4## geometry DISTRICT Status population## <MULTIPOLYGON [m]> <chr> <chr> <dbl>## 1 (((392952.6 594064.2, 392985.8 593971.5, 392986.2 … [UNKNOW… <NA> NA## 2 (((551311.8 581603.6, 551324.5 581599.7, 551334.5 … AMPARA Distr… 736000## 3 (((501928.5 712099.6, 501970.4 712098.8, 502020 71… ANURADH… Distr… 943000## 4 (((522825 568220.9, 522872.6 568217.7, 522926.1 56… BADULLA Distr… 886000## 5 (((609877 559315.9, 609857.5 559313, 609845.2 5593… BATTICA… Distr… 579000## 6 (((400911.5 497888.4, 401032.5 497869.3, 401035.2 … COLOMBO Distr… 2455000Dealing with our own datasets
DISTRICT <- c("Ampara", "Anuradhapura", "Badulla", "Batticaloa", "Colombo", "Galle", "Gampaha", "Hambantota", "Jaffna", "Kalutara", "Kandy", "Kegalle", "Kilinochchi", "Kurunegala", "Mannar", "Matale", "Matara", "Monaragala", "Mullaitivu", "Nuwara eliya", "Polonnaruwa", "Puttalam", "Ratnapura", "Trincomalee", "Vavuniya" )covidcount<- c(13867, 14351, 14290, 9824, 132418, 42314, 111221, 18631, 12222, 56672, 21369, 13225, 9597, 30507, 2523, 15211, 20905, 14723, 2192, 12240, 5197, 14901, 22650, 4364, 3644)newdate <- tibble(DISTRICT, covidcount )Convert case of a string
https://stringr.tidyverse.org/reference/case.html
head(newdate)## # A tibble: 6 × 2## DISTRICT covidcount## <chr> <dbl>## 1 Ampara 13867## 2 Anuradhapura 14351## 3 Badulla 14290## 4 Batticaloa 9824## 5 Colombo 132418## 6 Galle 42314newdate <- newdate %>% mutate(DISTRICT= stringr::str_to_upper( DISTRICT, locale = "en"))head(newdate)## # A tibble: 6 × 2## DISTRICT covidcount## <chr> <dbl>## 1 AMPARA 13867## 2 ANURADHAPURA 14351## 3 BADULLA 14290## 4 BATTICALOA 9824## 5 COLOMBO 132418## 6 GALLE 42314Merge Data
full_data <- left_join(district, newdate, by= "DISTRICT")head(full_data)## Simple feature collection with 6 features and 4 fields## Geometry type: MULTIPOLYGON## Dimension: XY## Bounding box: xmin: 391095.2 ymin: 445857.8 xmax: 621918.1 ymax: 712393.4## Projected CRS: SLD99 / Sri Lanka Grid 1999## # A tibble: 6 × 5## geometry DISTRICT Status population covidcount## <MULTIPOLYGON [m]> <chr> <chr> <dbl> <dbl>## 1 (((392952.6 594064.2, 392985.8 593971.5… [UNKNOW… <NA> NA NA## 2 (((551311.8 581603.6, 551324.5 581599.7… AMPARA Distr… 736000 13867## 3 (((501928.5 712099.6, 501970.4 712098.8… ANURADH… Distr… 943000 14351## 4 (((522825 568220.9, 522872.6 568217.7, … BADULLA Distr… 886000 14290## 5 (((609877 559315.9, 609857.5 559313, 60… BATTICA… Distr… 579000 9824## 6 (((400911.5 497888.4, 401032.5 497869.3… COLOMBO Distr… 2455000 132418Distribution of Total Covid Count by Districts
ggplot(full_data) + geom_sf(aes(fill = covidcount), show.legend = TRUE) + scale_fill_viridis()
pridiltal and thiyangt
Acknowledgements:
This work was supported in part by RETINA research lab funded by the OWSD, a program unit of United Nations Educational, Scientific and Cultural Organization (UNESCO).
All rights reserved by Thiyanga S. Talagala and Priyanga D Talagala