Data Wrangling with R
Dr Thiyanga Talagala
IASSL - 21/ 25 Feb, 2022
Data Wrangling/ Data Munging
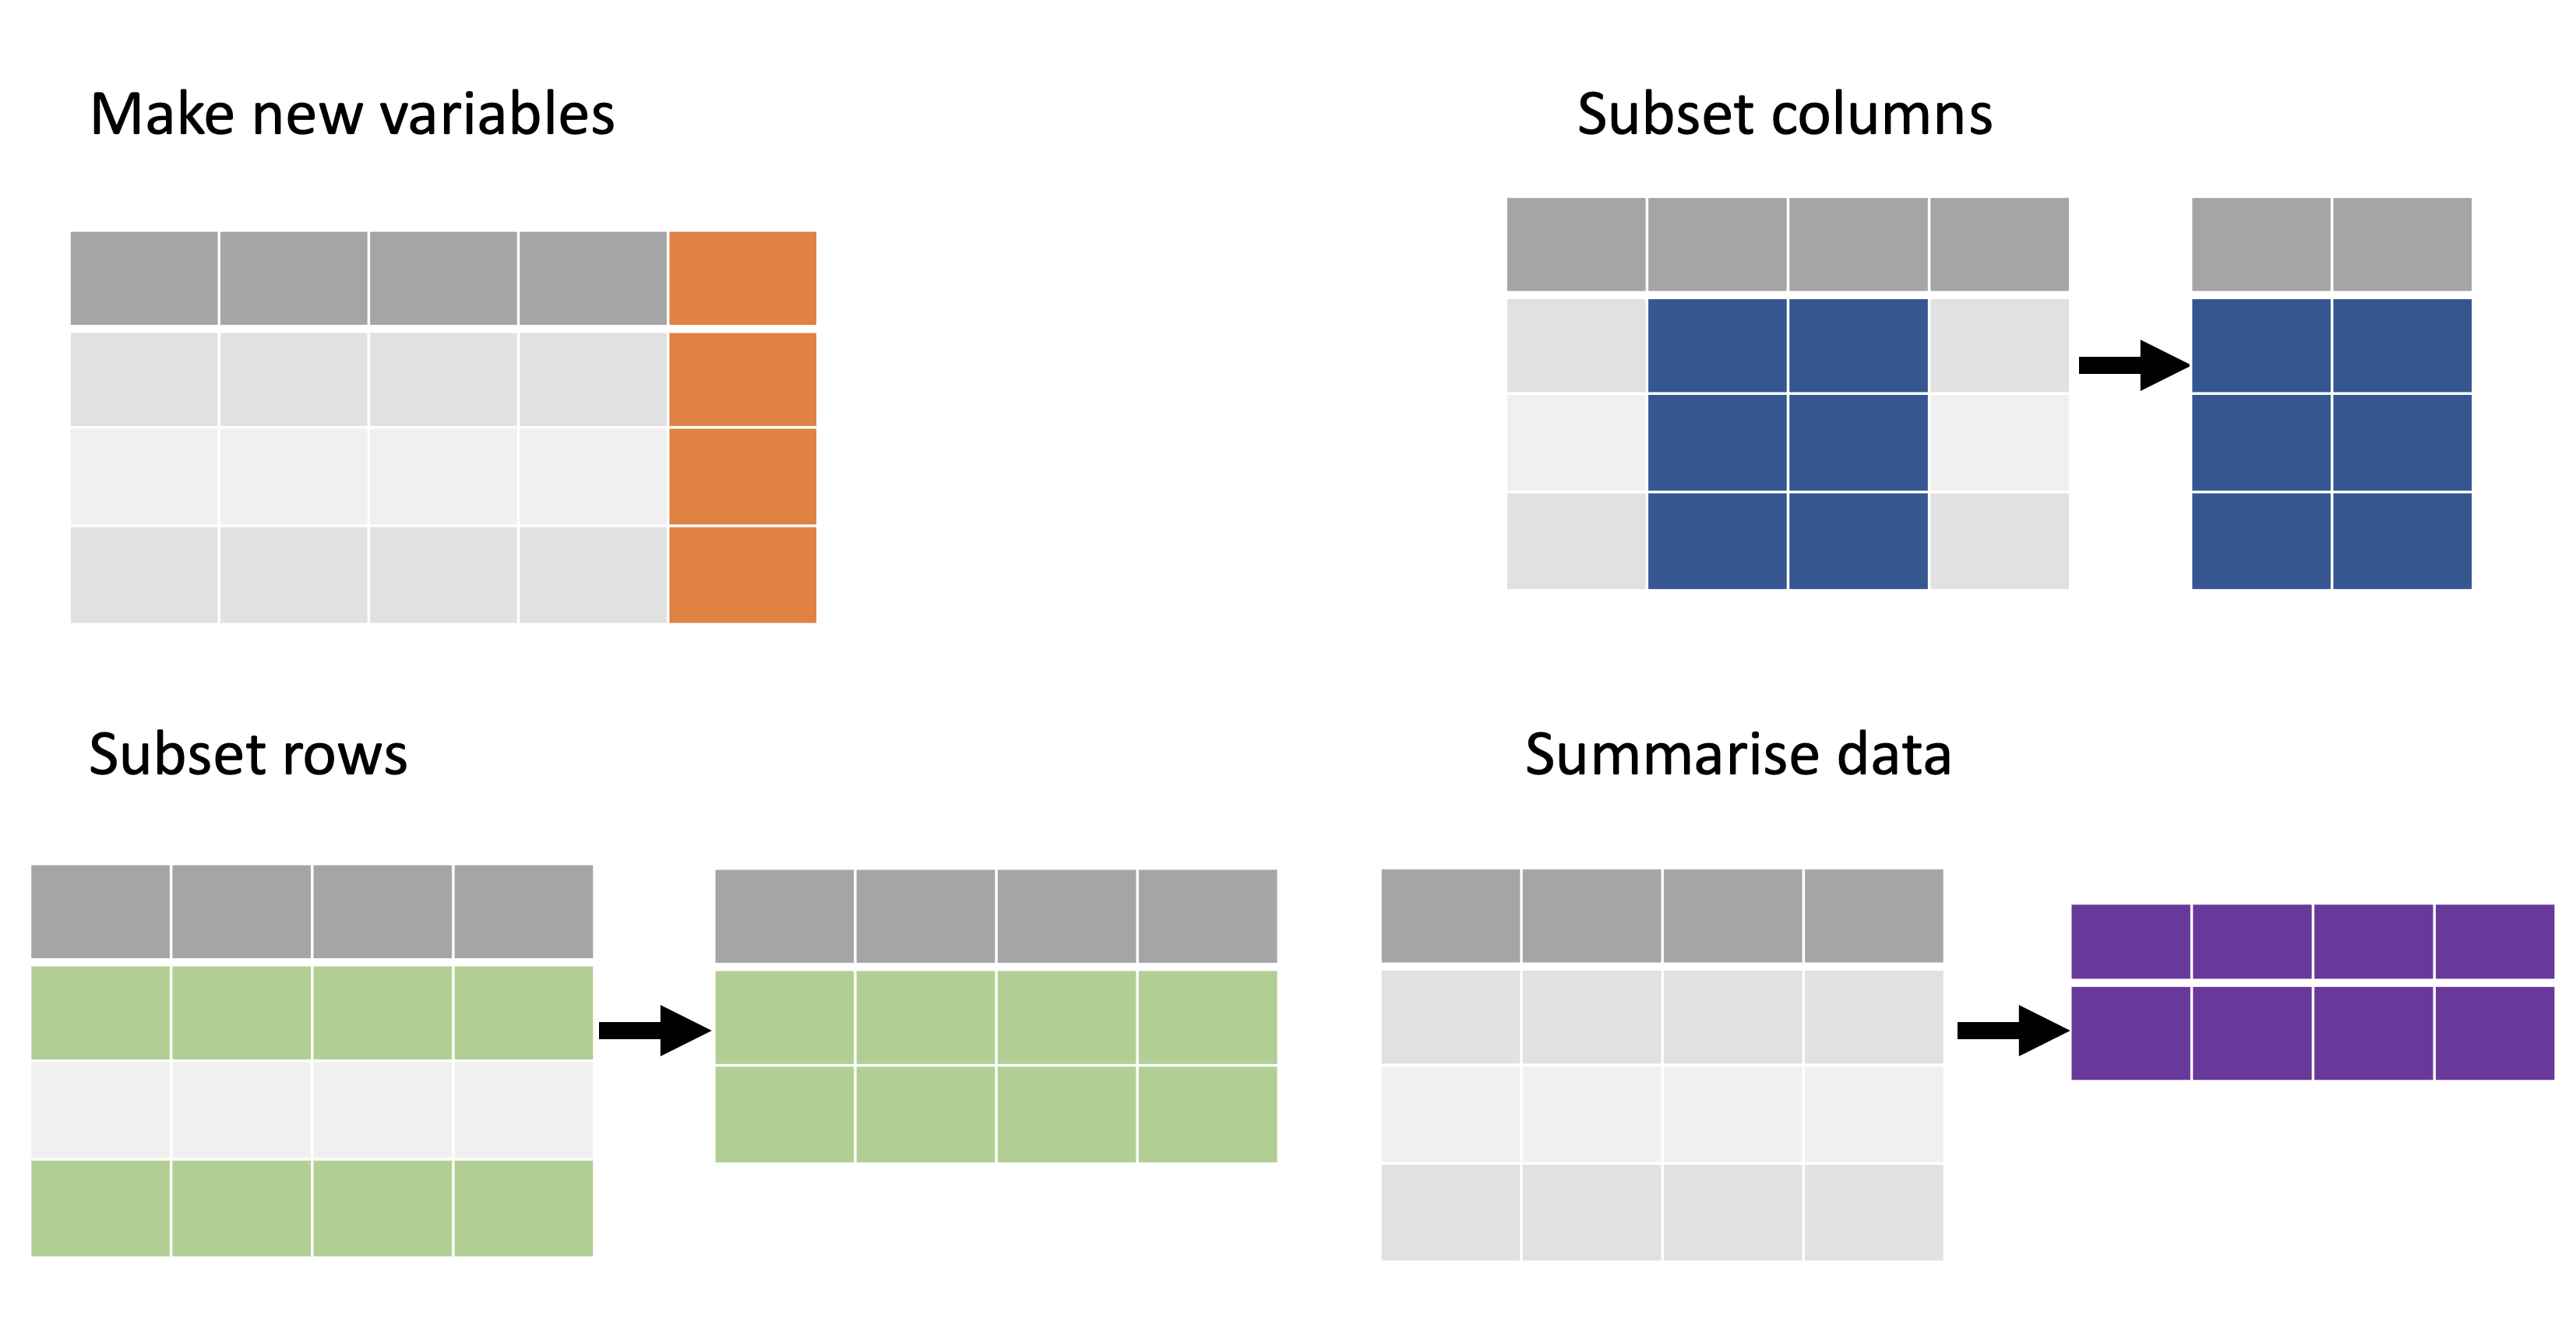
Reshaping data
pivot_wider
pivot_longer
seperate
unite
Tidy Data

Each variable is placed in its column
Each observation is placed in its own row
Each value is placed in its own cell
packages
library(tidyverse) #or library(tidyr)library(magrittr)

tidyr package
Hadley Wickham, Chief Scientist at RStudio explaining tidyr at WOMBAT organized by Monash University, Australia.
Image taken by Thiyanga S Talagala at WOMBAT Melbourne, Australia, December-2019
tidyr verbs
Main verbs
pivot_longer(gather)pivot_wider(spread)
Input and Output
Main input: data frame or tibble.
Output: tibble
pivot_longer
pivot_longer()
Turns columns into rows.
From wide format to long format.
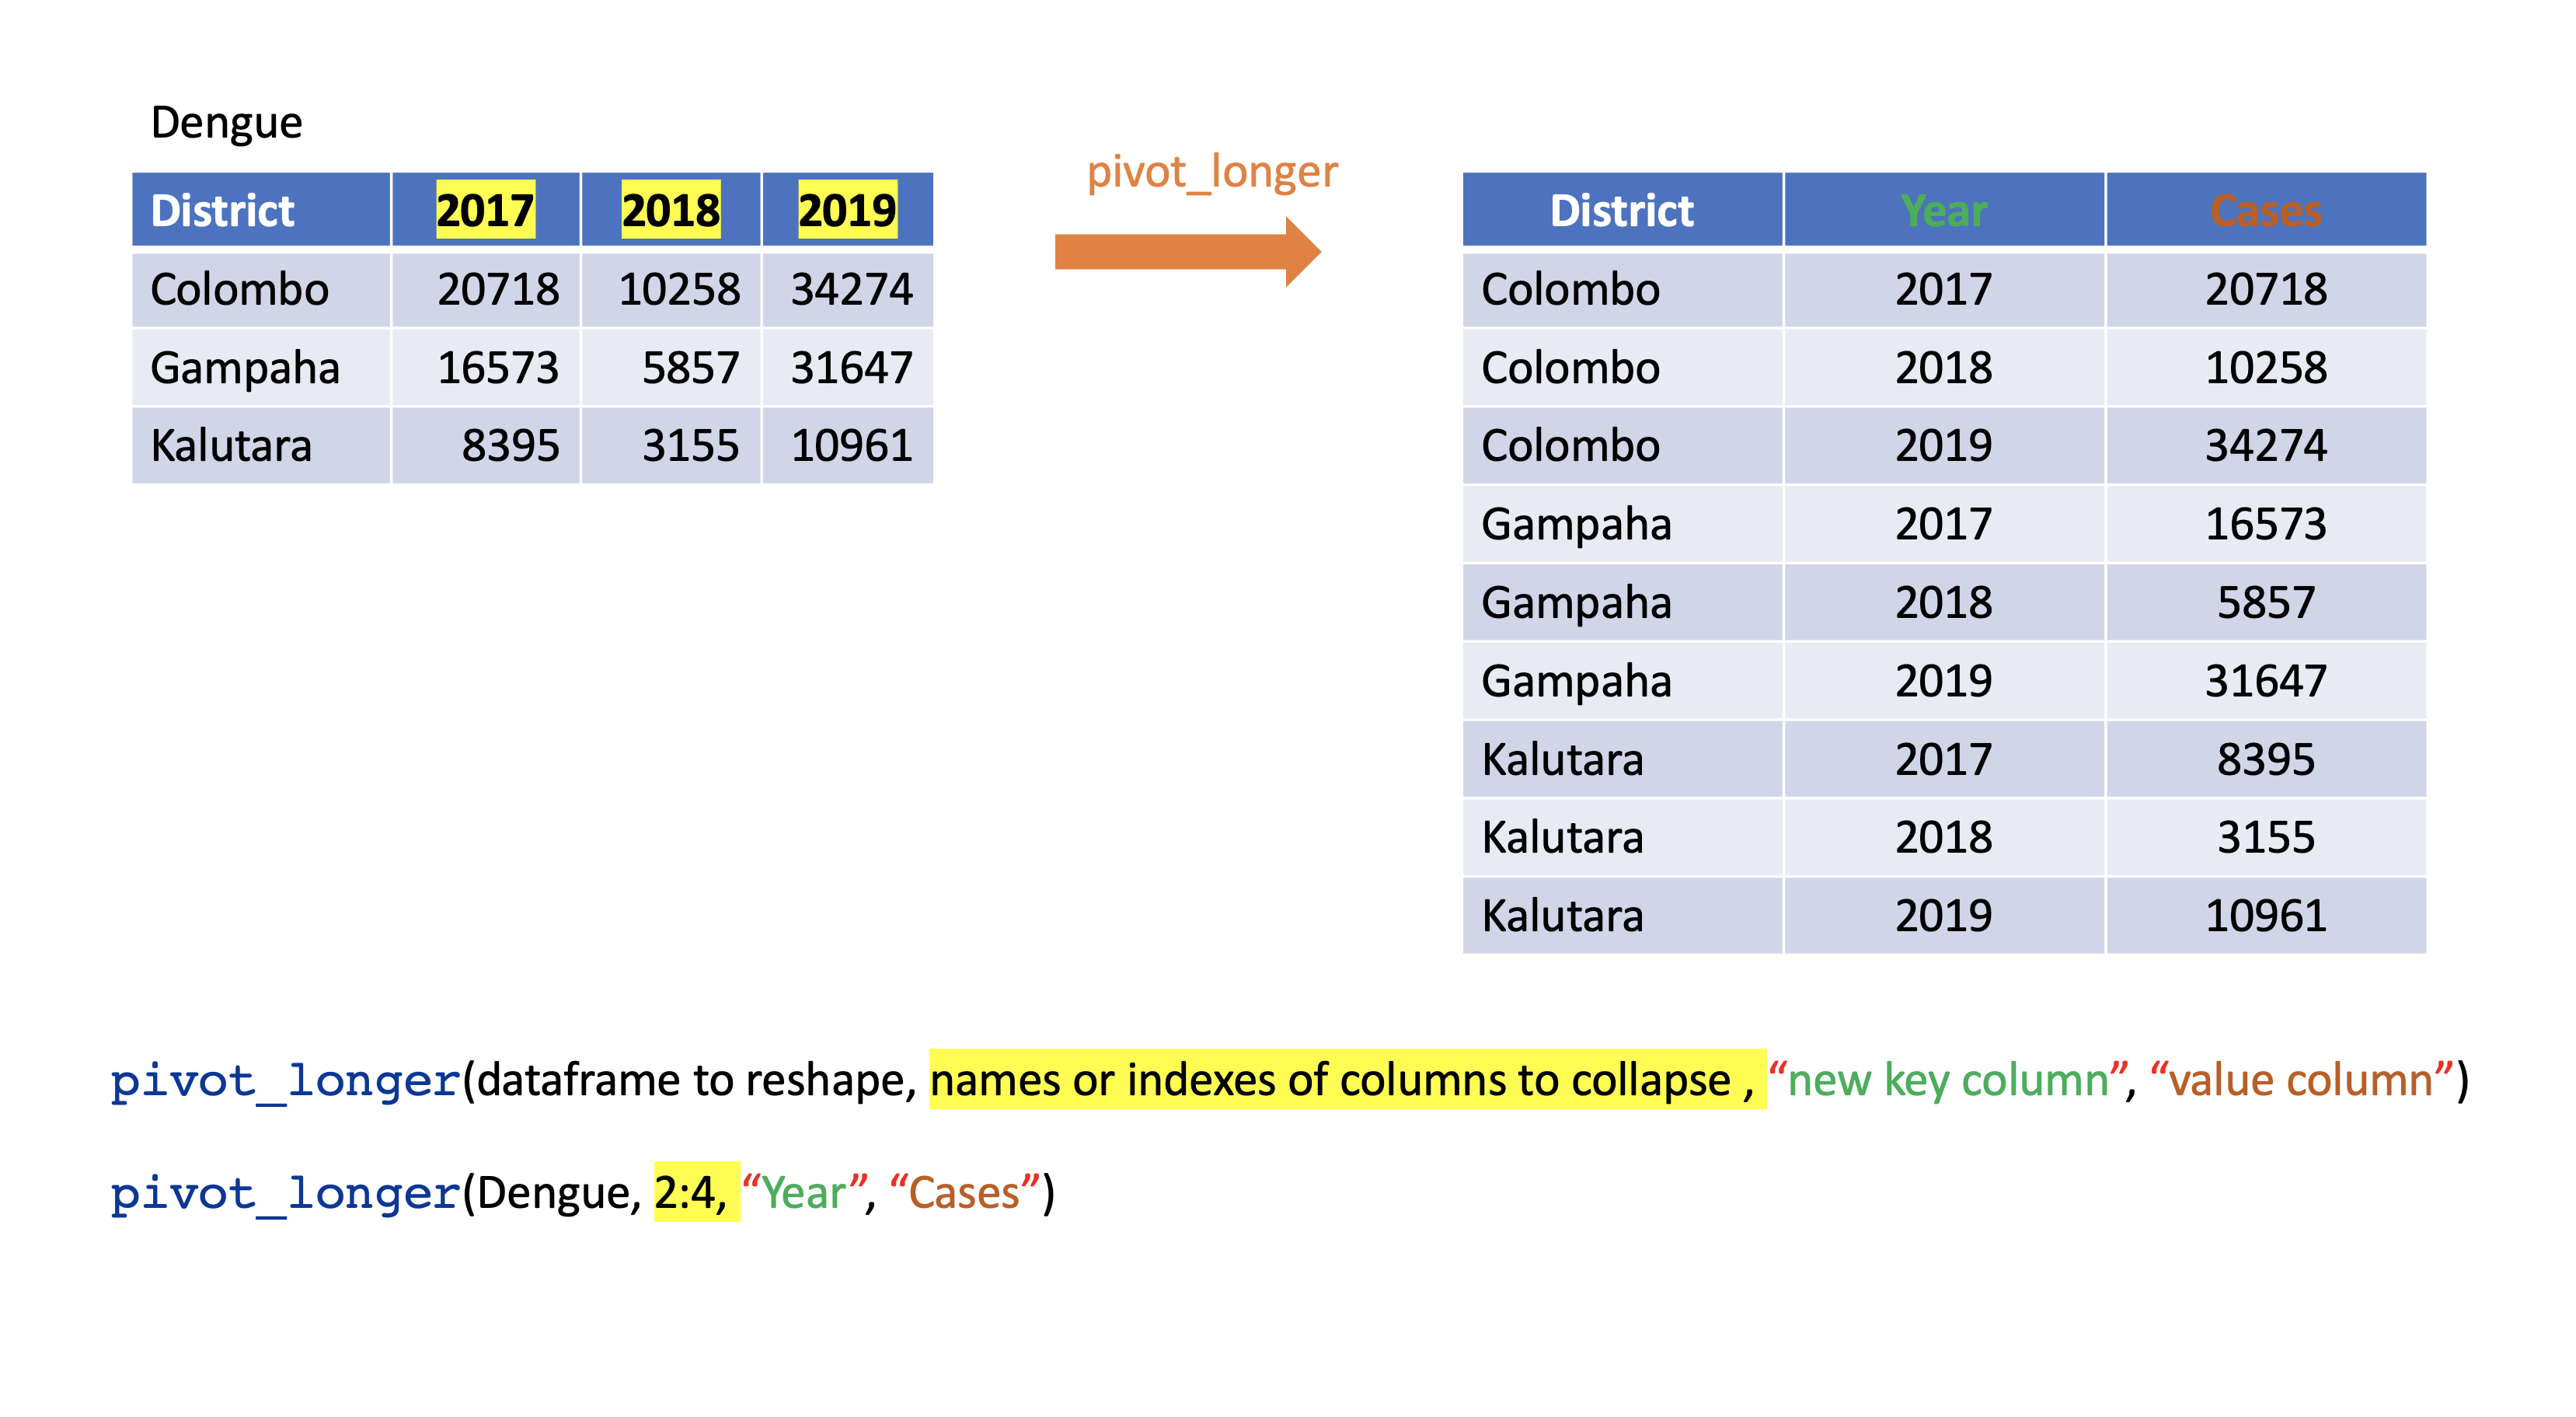
pivot_longer()
dengue <- tibble( dist = c("Colombo", "Gampaha", "Kalutara"), '2017' = c(20718, 10258, 34274), '2018' = c(16573, 5857, 31647), '2019' = c(8395, 3155, 10961)); dengue# A tibble: 3 × 4 dist `2017` `2018` `2019` <chr> <dbl> <dbl> <dbl>1 Colombo 20718 16573 83952 Gampaha 10258 5857 31553 Kalutara 34274 31647 10961dengue %>% pivot_longer(2:4, names_to="Year", values_to = "Dengue counts")# A tibble: 9 × 3 dist Year `Dengue counts` <chr> <chr> <dbl>1 Colombo 2017 207182 Colombo 2018 165733 Colombo 2019 83954 Gampaha 2017 102585 Gampaha 2018 58576 Gampaha 2019 31557 Kalutara 2017 342748 Kalutara 2018 316479 Kalutara 2019 10961pivot_wider
pivot_wider()
- From long to wide format.
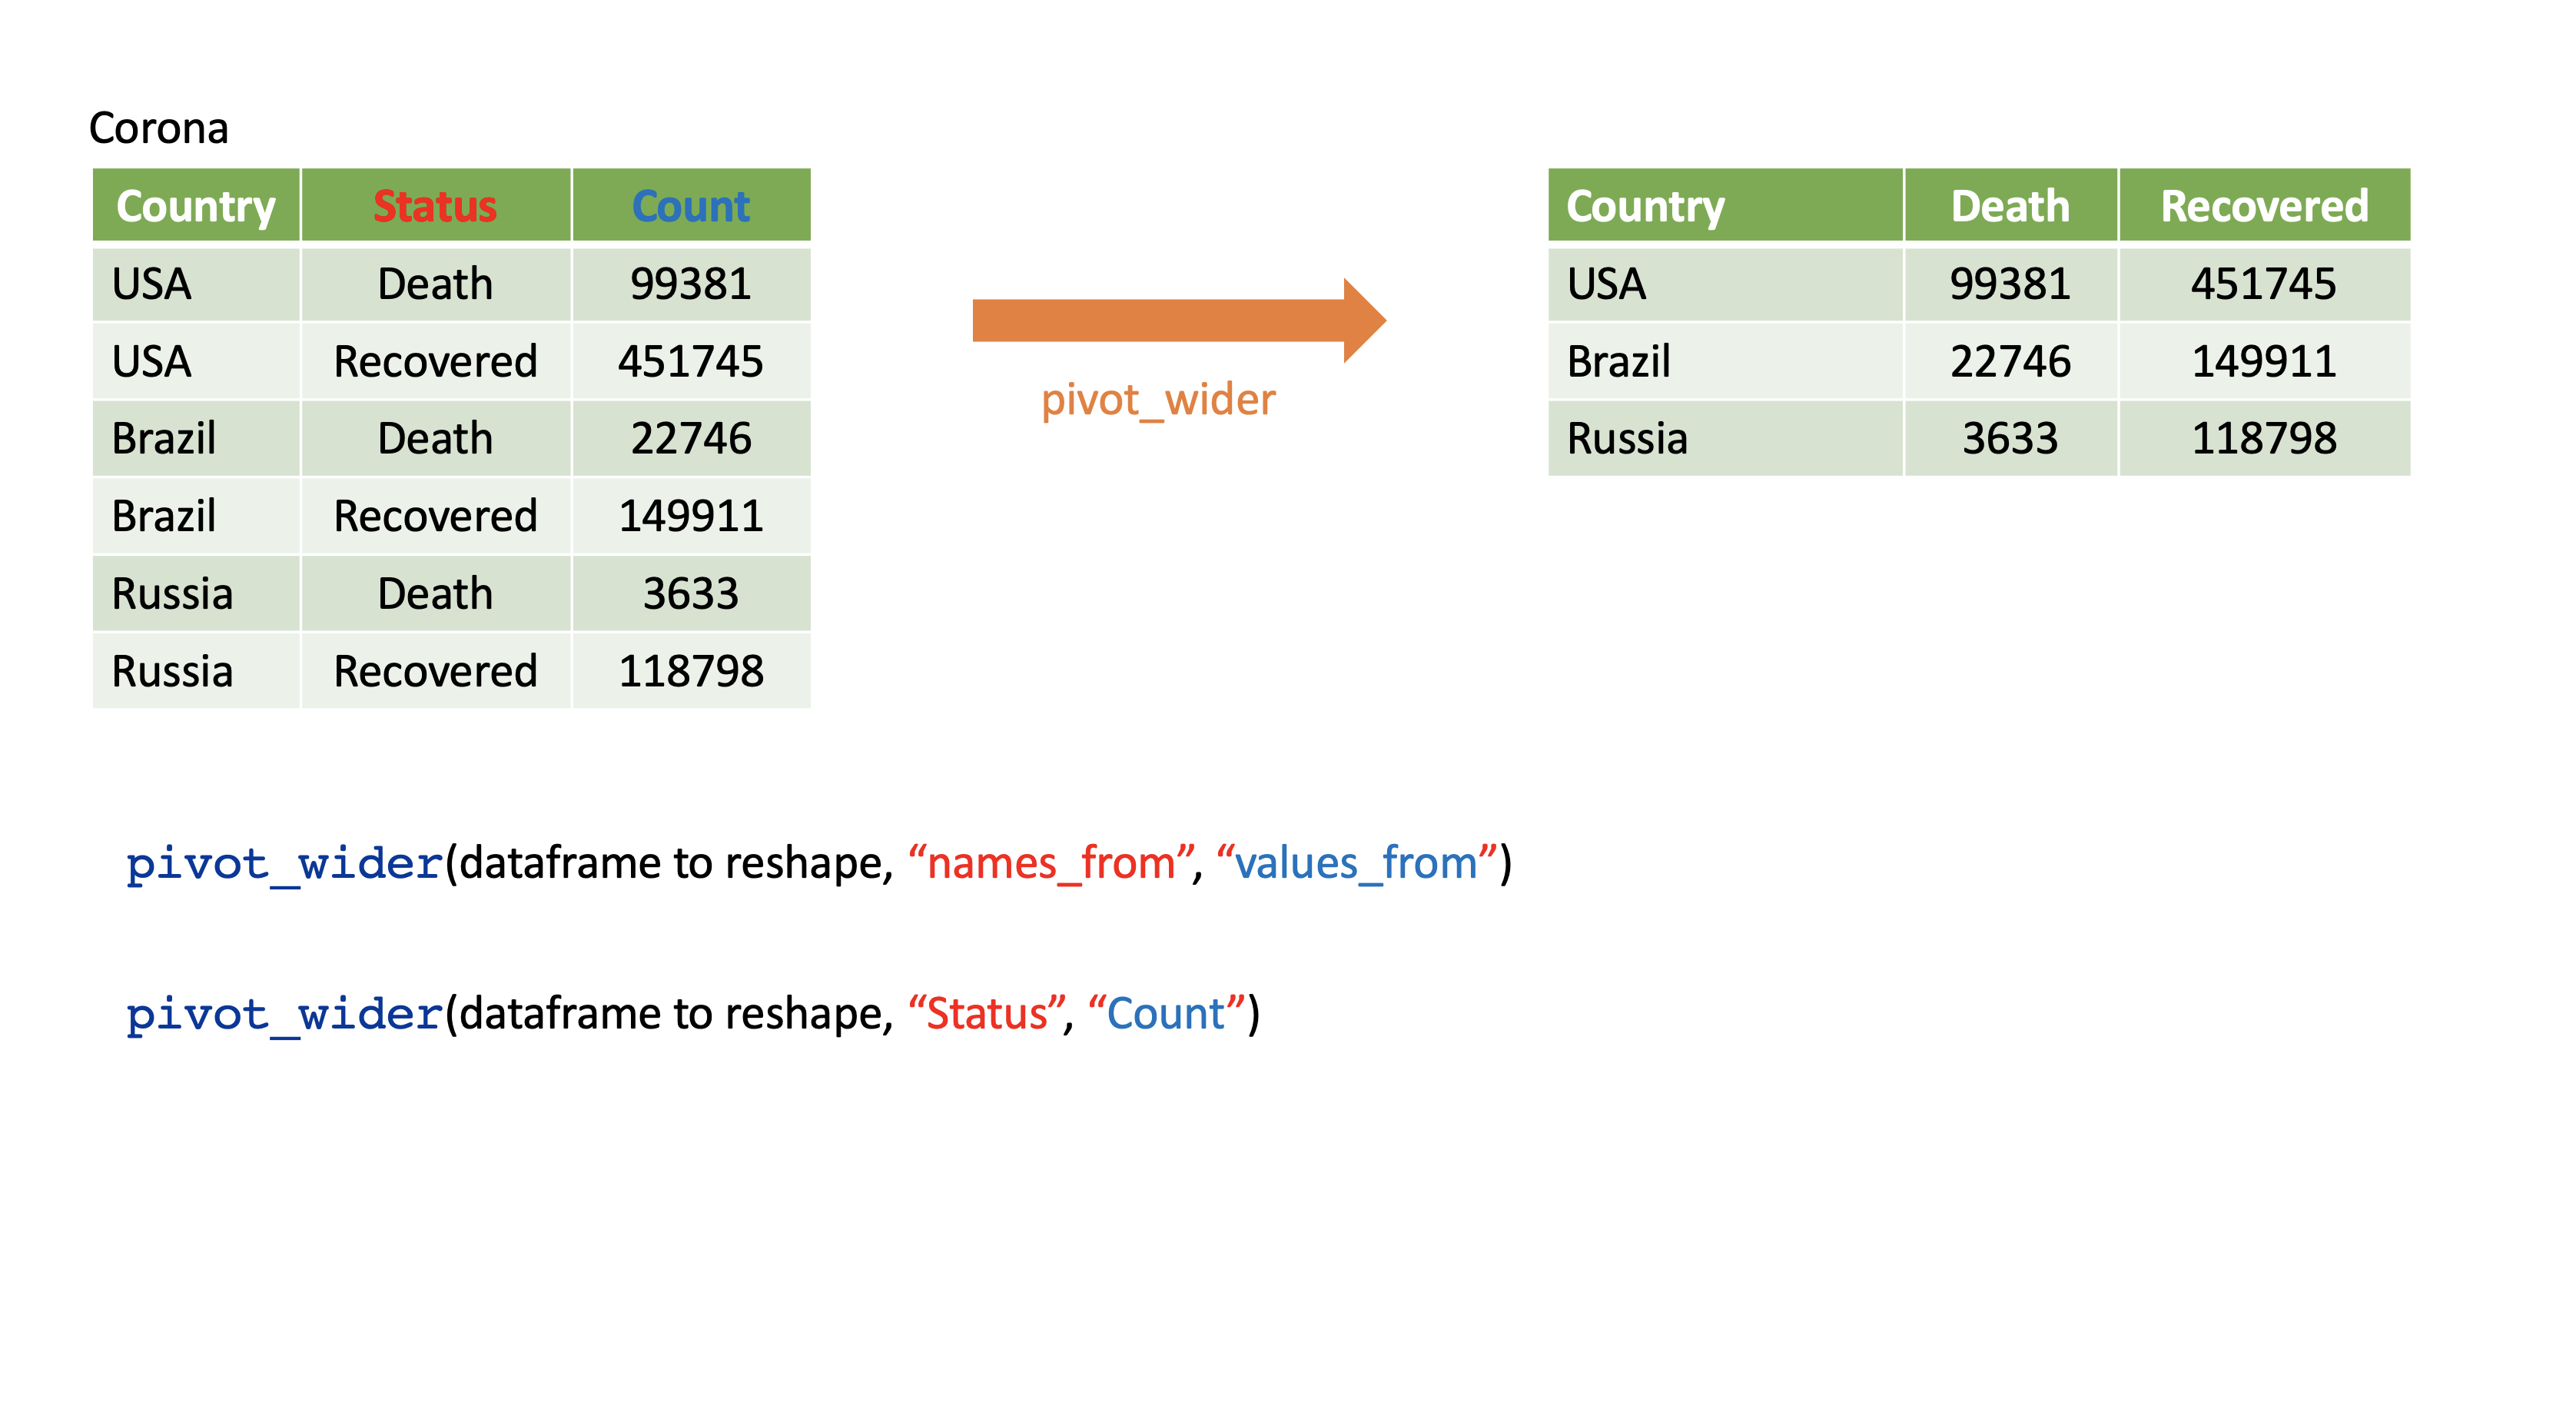
pivot_wider()
Corona <- tibble(country = rep(c("USA", "Brazil", "Russia"), each=2),status = rep(c("Death", "Recovered"), 3),count = c(99381, 451745, 22746, 149911, 3633, 118798))Corona# A tibble: 6 × 3 country status count <chr> <chr> <dbl>1 USA Death 993812 USA Recovered 4517453 Brazil Death 227464 Brazil Recovered 1499115 Russia Death 36336 Russia Recovered 118798pivot_wider()
Corona# A tibble: 6 × 3 country status count <chr> <chr> <dbl>1 USA Death 993812 USA Recovered 4517453 Brazil Death 227464 Brazil Recovered 1499115 Russia Death 36336 Russia Recovered 118798Corona %>% pivot_wider(names_from=status, values_from=count)# A tibble: 3 × 3 country Death Recovered <chr> <dbl> <dbl>1 USA 99381 4517452 Brazil 22746 1499113 Russia 3633 118798Assign a name:
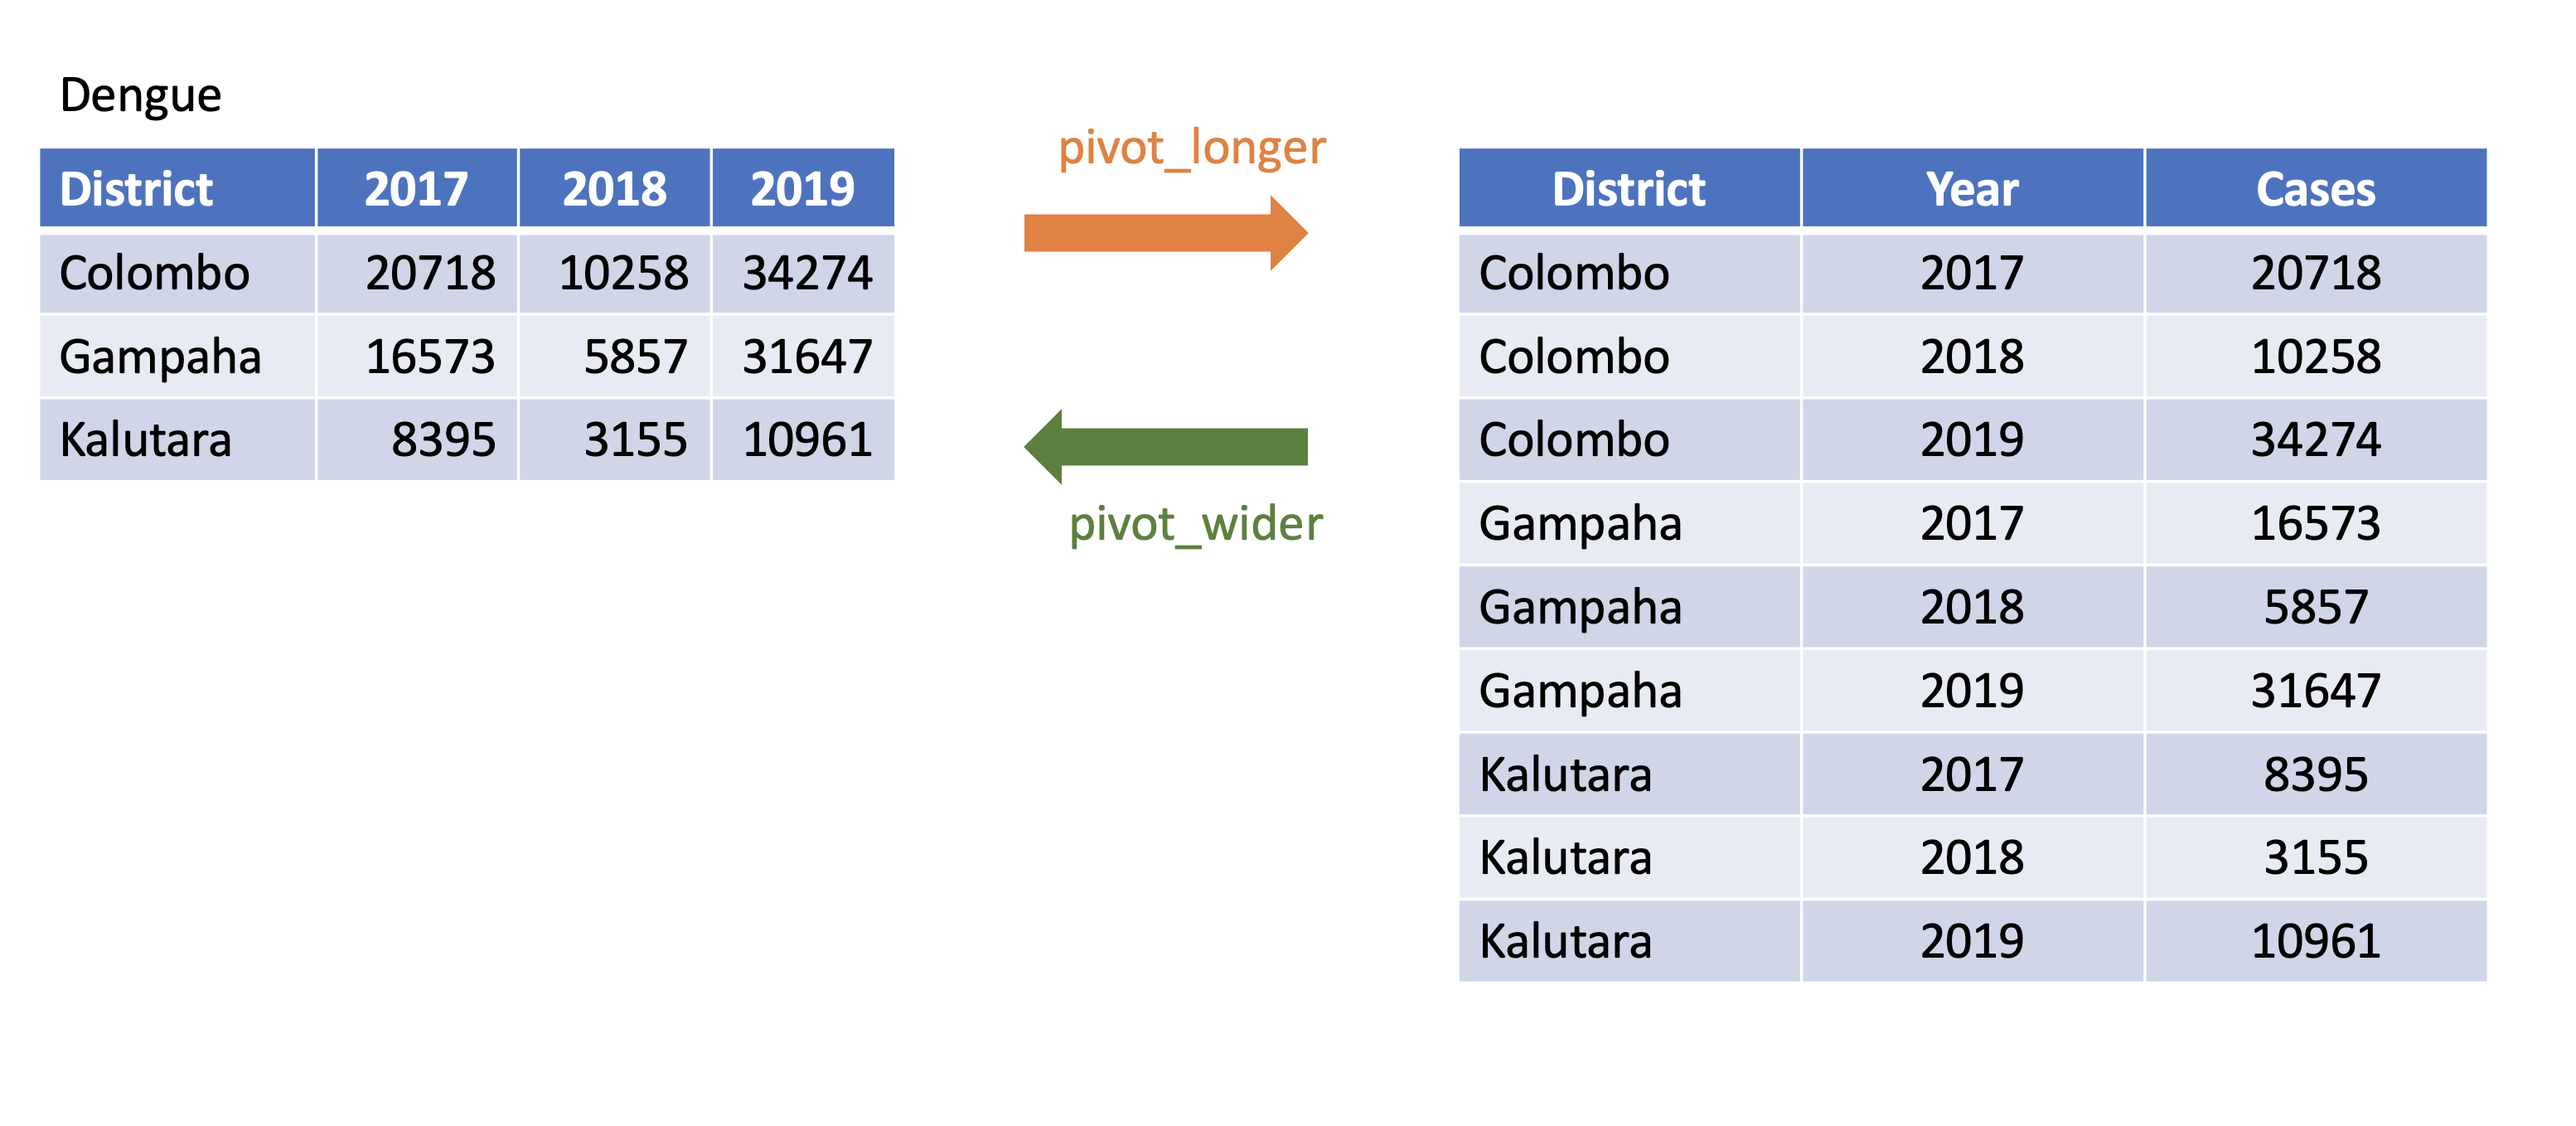
corona_wide_format <- Corona %>% pivot_wider(names_from=status, values_from=count)corona_wide_format# A tibble: 3 × 3 country Death Recovered <chr> <dbl> <dbl>1 USA 99381 4517452 Brazil 22746 1499113 Russia 3633 118798pivot_longer vs pivot_wider
class: duke-orange, center, middle
separate
separate()
- Separate one column into several columns.
Melbourne <- tibble(Date = c("10-5-2020", "11-5-2020", "12-5-2020","13-5-2020"), Tmin = c(5, 9, 9, 7), Tmax = c(18, 16, 16, 17), Rainfall= c(30, 40, 10, 5)); Melbourne# A tibble: 4 × 4 Date Tmin Tmax Rainfall <chr> <dbl> <dbl> <dbl>1 10-5-2020 5 18 302 11-5-2020 9 16 403 12-5-2020 9 16 104 13-5-2020 7 17 5separate(): Separate one column into several columns.
# A tibble: 4 × 4 Date Tmin Tmax Rainfall <chr> <dbl> <dbl> <dbl>1 10-5-2020 5 18 302 11-5-2020 9 16 403 12-5-2020 9 16 104 13-5-2020 7 17 5Melbourne %>% separate(Date, into=c("day", "month", "year"), sep="-")# A tibble: 4 × 6 day month year Tmin Tmax Rainfall <chr> <chr> <chr> <dbl> <dbl> <dbl>1 10 5 2020 5 18 302 11 5 2020 9 16 403 12 5 2020 9 16 104 13 5 2020 7 17 5separate()
df <- data.frame(x = c(NA, "a.b", "a.d", "b.c"))df x1 <NA>2 a.b3 a.d4 b.cdf %>% separate(x, c("Text1", "Text2")) Text1 Text21 <NA> <NA>2 a b3 a d4 b cseparate()
tbl <- tibble(input = c("a", "a b", "a-b c", NA))tbl# A tibble: 4 × 1 input <chr>1 a 2 a b 3 a-b c4 <NA>separate()
tbl <- tibble(input = c("a", "a b", "a-b c", NA))tbl# A tibble: 4 × 1 input <chr>1 a 2 a b 3 a-b c4 <NA>tbl %>% separate(input, c("Input1", "Input2"))# A tibble: 4 × 2 Input1 Input2 <chr> <chr> 1 a <NA> 2 a b 3 a b 4 <NA> <NA>separate()
tbl <- tibble(input = c("a", "a b", "a-b c", NA)); tbl# A tibble: 4 × 1 input <chr>1 a 2 a b 3 a-b c4 <NA>separate()
tbl <- tibble(input = c("a", "a b", "a-b c", NA)); tbl# A tibble: 4 × 1 input <chr>1 a 2 a b 3 a-b c4 <NA>tbl %>% separate(input, c("Input1", "Input2", "Input3"))# A tibble: 4 × 3 Input1 Input2 Input3 <chr> <chr> <chr> 1 a <NA> <NA> 2 a b <NA> 3 a b c 4 <NA> <NA> <NA>unite
unite()
- Unite several columns into one.
projects <- tibble( Country = c("USA", "USA", "AUS", "AUS"), State = c("LA", "CO", "VIC", "NSW"), Cost = c(1000, 11000, 20000,30000))projects# A tibble: 4 × 3 Country State Cost <chr> <chr> <dbl>1 USA LA 10002 USA CO 110003 AUS VIC 200004 AUS NSW 30000unite()
# A tibble: 4 × 3 Country State Cost <chr> <chr> <dbl>1 USA LA 10002 USA CO 110003 AUS VIC 200004 AUS NSW 30000projects %>% unite("Location", c("State", "Country"))# A tibble: 4 × 2 Location Cost <chr> <dbl>1 LA_USA 10002 CO_USA 110003 VIC_AUS 200004 NSW_AUS 30000unite()
# A tibble: 4 × 3 Country State Cost <chr> <chr> <dbl>1 USA LA 10002 USA CO 110003 AUS VIC 200004 AUS NSW 30000projects %>% unite("Location", c("State", "Country"), sep="-")# A tibble: 4 × 2 Location Cost <chr> <dbl>1 LA-USA 10002 CO-USA 110003 VIC-AUS 200004 NSW-AUS 30000filterselectmutatesummarisearrangegroup_byrename
packages
library(tidyverse) # To obtain dplyrlibrary(magrittr)

Dataset
library(palmerpenguins)data(penguins)head(penguins)# A tibble: 6 × 8 species island bill_length_mm bill_depth_mm flipper_length_… body_mass_g sex <fct> <fct> <dbl> <dbl> <int> <int> <fct>1 Adelie Torge… 39.1 18.7 181 3750 male 2 Adelie Torge… 39.5 17.4 186 3800 fema…3 Adelie Torge… 40.3 18 195 3250 fema…4 Adelie Torge… NA NA NA NA <NA> 5 Adelie Torge… 36.7 19.3 193 3450 fema…6 Adelie Torge… 39.3 20.6 190 3650 male # … with 1 more variable: year <int>summary(penguins) species island bill_length_mm bill_depth_mm Adelie :152 Biscoe :168 Min. :32.10 Min. :13.10 Chinstrap: 68 Dream :124 1st Qu.:39.23 1st Qu.:15.60 Gentoo :124 Torgersen: 52 Median :44.45 Median :17.30 Mean :43.92 Mean :17.15 3rd Qu.:48.50 3rd Qu.:18.70 Max. :59.60 Max. :21.50 NA's :2 NA's :2 flipper_length_mm body_mass_g sex year Min. :172.0 Min. :2700 female:165 Min. :2007 1st Qu.:190.0 1st Qu.:3550 male :168 1st Qu.:2007 Median :197.0 Median :4050 NA's : 11 Median :2008 Mean :200.9 Mean :4202 Mean :2008 3rd Qu.:213.0 3rd Qu.:4750 3rd Qu.:2009 Max. :231.0 Max. :6300 Max. :2009 NA's :2 NA's :2dplyr verbs
filterselectmutatesummarise
arrangegroup_byrename
filter: Picks observations by their values.
- Takes logical expressions and returns the rows for which all are
TRUE.
filter(penguins, flipper_length_mm > 180)# A tibble: 329 × 8 species island bill_length_mm bill_depth_mm flipper_length_mm body_mass_g <fct> <fct> <dbl> <dbl> <int> <int> 1 Adelie Torgersen 39.1 18.7 181 3750 2 Adelie Torgersen 39.5 17.4 186 3800 3 Adelie Torgersen 40.3 18 195 3250 4 Adelie Torgersen 36.7 19.3 193 3450 5 Adelie Torgersen 39.3 20.6 190 3650 6 Adelie Torgersen 38.9 17.8 181 3625 7 Adelie Torgersen 39.2 19.6 195 4675 8 Adelie Torgersen 34.1 18.1 193 3475 9 Adelie Torgersen 42 20.2 190 425010 Adelie Torgersen 37.8 17.1 186 3300# … with 319 more rows, and 2 more variables: sex <fct>, year <int>filter (cont)
# penguins %>% filter(species == "Chinstrap")filter(penguins, species == "Chinstrap")# A tibble: 68 × 8 species island bill_length_mm bill_depth_mm flipper_length_mm body_mass_g <fct> <fct> <dbl> <dbl> <int> <int> 1 Chinstrap Dream 46.5 17.9 192 3500 2 Chinstrap Dream 50 19.5 196 3900 3 Chinstrap Dream 51.3 19.2 193 3650 4 Chinstrap Dream 45.4 18.7 188 3525 5 Chinstrap Dream 52.7 19.8 197 3725 6 Chinstrap Dream 45.2 17.8 198 3950 7 Chinstrap Dream 46.1 18.2 178 3250 8 Chinstrap Dream 51.3 18.2 197 3750 9 Chinstrap Dream 46 18.9 195 415010 Chinstrap Dream 51.3 19.9 198 3700# … with 58 more rows, and 2 more variables: sex <fct>, year <int>select: Picks variables by their names.
head(penguins, 3)# A tibble: 3 × 8 species island bill_length_mm bill_depth_mm flipper_length_… body_mass_g sex <fct> <fct> <dbl> <dbl> <int> <int> <fct>1 Adelie Torge… 39.1 18.7 181 3750 male 2 Adelie Torge… 39.5 17.4 186 3800 fema…3 Adelie Torge… 40.3 18 195 3250 fema…# … with 1 more variable: year <int>select(penguins, bill_length_mm:body_mass_g)# A tibble: 344 × 4 bill_length_mm bill_depth_mm flipper_length_mm body_mass_g <dbl> <dbl> <int> <int> 1 39.1 18.7 181 3750 2 39.5 17.4 186 3800 3 40.3 18 195 3250 4 NA NA NA NA 5 36.7 19.3 193 3450 6 39.3 20.6 190 3650 7 38.9 17.8 181 3625 8 39.2 19.6 195 4675 9 34.1 18.1 193 347510 42 20.2 190 4250# … with 334 more rowsselect (cont.)
head(penguins, 3)# A tibble: 3 × 8 species island bill_length_mm bill_depth_mm flipper_length_… body_mass_g sex <fct> <fct> <dbl> <dbl> <int> <int> <fct>1 Adelie Torge… 39.1 18.7 181 3750 male 2 Adelie Torge… 39.5 17.4 186 3800 fema…3 Adelie Torge… 40.3 18 195 3250 fema…# … with 1 more variable: year <int>select(penguins, species, body_mass_g)# A tibble: 344 × 2 species body_mass_g <fct> <int> 1 Adelie 3750 2 Adelie 3800 3 Adelie 3250 4 Adelie NA 5 Adelie 3450 6 Adelie 3650 7 Adelie 3625 8 Adelie 4675 9 Adelie 347510 Adelie 4250# … with 334 more rowsselect (cont.)
head(penguins, 3)# A tibble: 3 × 8 species island bill_length_mm bill_depth_mm flipper_length_… body_mass_g sex <fct> <fct> <dbl> <dbl> <int> <int> <fct>1 Adelie Torge… 39.1 18.7 181 3750 male 2 Adelie Torge… 39.5 17.4 186 3800 fema…3 Adelie Torge… 40.3 18 195 3250 fema…# … with 1 more variable: year <int>select(penguins, -c(island, year))# A tibble: 344 × 6 species bill_length_mm bill_depth_mm flipper_length_mm body_mass_g sex <fct> <dbl> <dbl> <int> <int> <fct> 1 Adelie 39.1 18.7 181 3750 male 2 Adelie 39.5 17.4 186 3800 female 3 Adelie 40.3 18 195 3250 female 4 Adelie NA NA NA NA <NA> 5 Adelie 36.7 19.3 193 3450 female 6 Adelie 39.3 20.6 190 3650 male 7 Adelie 38.9 17.8 181 3625 female 8 Adelie 39.2 19.6 195 4675 male 9 Adelie 34.1 18.1 193 3475 <NA> 10 Adelie 42 20.2 190 4250 <NA> # … with 334 more rowsmutate
- Creates new variables with functions of existing variables
penguins <- penguins %>% mutate(BMI = body_mass_g / 1000)penguins# A tibble: 344 × 9 species island bill_length_mm bill_depth_mm flipper_length_mm body_mass_g <fct> <fct> <dbl> <dbl> <int> <int> 1 Adelie Torgersen 39.1 18.7 181 3750 2 Adelie Torgersen 39.5 17.4 186 3800 3 Adelie Torgersen 40.3 18 195 3250 4 Adelie Torgersen NA NA NA NA 5 Adelie Torgersen 36.7 19.3 193 3450 6 Adelie Torgersen 39.3 20.6 190 3650 7 Adelie Torgersen 38.9 17.8 181 3625 8 Adelie Torgersen 39.2 19.6 195 4675 9 Adelie Torgersen 34.1 18.1 193 347510 Adelie Torgersen 42 20.2 190 4250# … with 334 more rows, and 3 more variables: sex <fct>, year <int>, BMI <dbl>summarise(British) or summarize (US)
- Collapse many values down to a single summary
penguins %>% summarise( bill_length_mm_mean=mean(bill_length_mm), bill_length_mm_median=median(bill_length_mm), BMI_mean=mean(BMI))# A tibble: 1 × 3 bill_length_mm_mean bill_length_mm_median BMI_mean <dbl> <dbl> <dbl>1 NA NA NAsummarise(British) or summarize (US)
- Collapse many values down to a single summary
penguins %>% summarise( bill_length_mm_mean=mean(bill_length_mm, na.rm=TRUE), bill_length_mm_median=median(bill_length_mm, na.rm=TRUE), BMI_mean=mean(BMI, na.rm=TRUE))# A tibble: 1 × 3 bill_length_mm_mean bill_length_mm_median BMI_mean <dbl> <dbl> <dbl>1 43.9 44.4 4.20arrange
- Reorder the rows
arrange(penguins, desc(body_mass_g))# A tibble: 344 × 9 species island bill_length_mm bill_depth_mm flipper_length_mm body_mass_g <fct> <fct> <dbl> <dbl> <int> <int> 1 Gentoo Biscoe 49.2 15.2 221 6300 2 Gentoo Biscoe 59.6 17 230 6050 3 Gentoo Biscoe 51.1 16.3 220 6000 4 Gentoo Biscoe 48.8 16.2 222 6000 5 Gentoo Biscoe 45.2 16.4 223 5950 6 Gentoo Biscoe 49.8 15.9 229 5950 7 Gentoo Biscoe 48.4 14.6 213 5850 8 Gentoo Biscoe 49.3 15.7 217 5850 9 Gentoo Biscoe 55.1 16 230 585010 Gentoo Biscoe 49.5 16.2 229 5800# … with 334 more rows, and 3 more variables: sex <fct>, year <int>, BMI <dbl>group_by
- Takes an existing tibble and converts it into a grouped tibble where operations are performed "by group". ungroup() removes grouping.
group_by
penguins_grouped <- penguins %>% group_by(species)penguins_grouped# A tibble: 344 × 9# Groups: species [3] species island bill_length_mm bill_depth_mm flipper_length_mm body_mass_g <fct> <fct> <dbl> <dbl> <int> <int> 1 Adelie Torgersen 39.1 18.7 181 3750 2 Adelie Torgersen 39.5 17.4 186 3800 3 Adelie Torgersen 40.3 18 195 3250 4 Adelie Torgersen NA NA NA NA 5 Adelie Torgersen 36.7 19.3 193 3450 6 Adelie Torgersen 39.3 20.6 190 3650 7 Adelie Torgersen 38.9 17.8 181 3625 8 Adelie Torgersen 39.2 19.6 195 4675 9 Adelie Torgersen 34.1 18.1 193 347510 Adelie Torgersen 42 20.2 190 4250# … with 334 more rows, and 3 more variables: sex <fct>, year <int>, BMI <dbl>group_by (cont.)
penguins %>% summarise(BMI_mean=mean(BMI, na.rm=TRUE))# A tibble: 1 × 1 BMI_mean <dbl>1 4.20penguins_grouped %>% summarise(BMI_mean=mean(BMI, na.rm=TRUE))# A tibble: 3 × 2 species BMI_mean <fct> <dbl>1 Adelie 3.702 Chinstrap 3.733 Gentoo 5.08rename
- Rename variables
head(penguins, 3)# A tibble: 3 × 9 species island bill_length_mm bill_depth_mm flipper_length_… body_mass_g sex <fct> <fct> <dbl> <dbl> <int> <int> <fct>1 Adelie Torge… 39.1 18.7 181 3750 male 2 Adelie Torge… 39.5 17.4 186 3800 fema…3 Adelie Torge… 40.3 18 195 3250 fema…# … with 2 more variables: year <int>, BMI <dbl>rename
penguins <- rename(penguins, `Bill length`=bill_length_mm, Location=island) # new_name = old_namepenguins# A tibble: 344 × 9 species Location `Bill length` bill_depth_mm flipper_length_mm body_mass_g <fct> <fct> <dbl> <dbl> <int> <int> 1 Adelie Torgersen 39.1 18.7 181 3750 2 Adelie Torgersen 39.5 17.4 186 3800 3 Adelie Torgersen 40.3 18 195 3250 4 Adelie Torgersen NA NA NA NA 5 Adelie Torgersen 36.7 19.3 193 3450 6 Adelie Torgersen 39.3 20.6 190 3650 7 Adelie Torgersen 38.9 17.8 181 3625 8 Adelie Torgersen 39.2 19.6 195 4675 9 Adelie Torgersen 34.1 18.1 193 347510 Adelie Torgersen 42 20.2 190 4250# … with 334 more rows, and 3 more variables: sex <fct>, year <int>, BMI <dbl>Combine multiple operations
penguins %>%filter(species == 'Gentoo') %>% head(2)# A tibble: 2 × 9 species Location `Bill length` bill_depth_mm flipper_length_mm body_mass_g <fct> <fct> <dbl> <dbl> <int> <int>1 Gentoo Biscoe 46.1 13.2 211 45002 Gentoo Biscoe 50 16.3 230 5700# … with 3 more variables: sex <fct>, year <int>, BMI <dbl>penguins %>%filter(species == 'Gentoo') %>% summarise(BMI_mean=mean(BMI, na.rm=TRUE))# A tibble: 1 × 1 BMI_mean <dbl>1 5.08Combine multiple operations
penguins %>%filter(species == 'Adelie') %>%group_by(Location) %>%filter(bill_depth_mm > 20) %>%arrange(desc(flipper_length_mm))# A tibble: 14 × 9# Groups: Location [3] species Location `Bill length` bill_depth_mm flipper_length_mm body_mass_g <fct> <fct> <dbl> <dbl> <int> <int> 1 Adelie Dream 40.2 20.1 200 3975 2 Adelie Torgersen 37.3 20.5 199 3775 3 Adelie Torgersen 34.6 21.1 198 4400 4 Adelie Torgersen 42.5 20.7 197 4500 5 Adelie Dream 39.2 21.1 196 4150 6 Adelie Biscoe 41.3 21.1 195 4400 7 Adelie Torgersen 46 21.5 194 4200 8 Adelie Dream 41.3 20.3 194 3550 9 Adelie Torgersen 38.6 21.2 191 380010 Adelie Dream 42.3 21.2 191 415011 Adelie Biscoe 45.6 20.3 191 460012 Adelie Biscoe 39.6 20.7 191 390013 Adelie Torgersen 39.3 20.6 190 365014 Adelie Torgersen 42 20.2 190 4250# … with 3 more variables: sex <fct>, year <int>, BMI <dbl>All rights reserved by Thiyanga S. Talagala and Priyanga D Talagala